How a Czech Grocery Chain Cut Milk Spoilage by 40%
A regional grocery chain across Central Bohemia was throwing away one in five dairy products. The root cause wasn't bad milk — it was identical reorder rules applied to 12 stores with wildly different demand and delivery speeds. Per-store computed reorder points cut spoilage from 21% to 12% in six months.
The Client
A regional grocery chain operating 12 stores across Central Bohemia — from high-traffic Prague locations to small-town shops near Kutná Hora. Around 200 chilled dairy SKUs (milk, yogurt, cream, cheese) sourced from three local cooperatives, with daily or every-other-day deliveries. Inventory and purchasing managed in Odoo.
The Problem: One Spreadsheet for 12 Stores
Dairy spoilage was running at 18–22% across the chain. Store managers set reorder points by copy-pasting values from a shared spreadsheet: min_qty=50, max_qty=100 for milk at every location. No differentiation between a Prague store selling 80 cartons per day and a small-town store selling 15.
The supplier lead times varied by location, but Odoo carried a single static number — “2 days” — for all stores. Nobody measured the actual spoilage-to-demand ratio per store. Waste was treated as the cost of doing business.
Step 1: Lead Time Inference
We extracted 18 months of purchase order receipt data from Odoo and built empirical lead time distributions per supplier per store location. The same dairy cooperative showed dramatically different delivery patterns depending on geography:
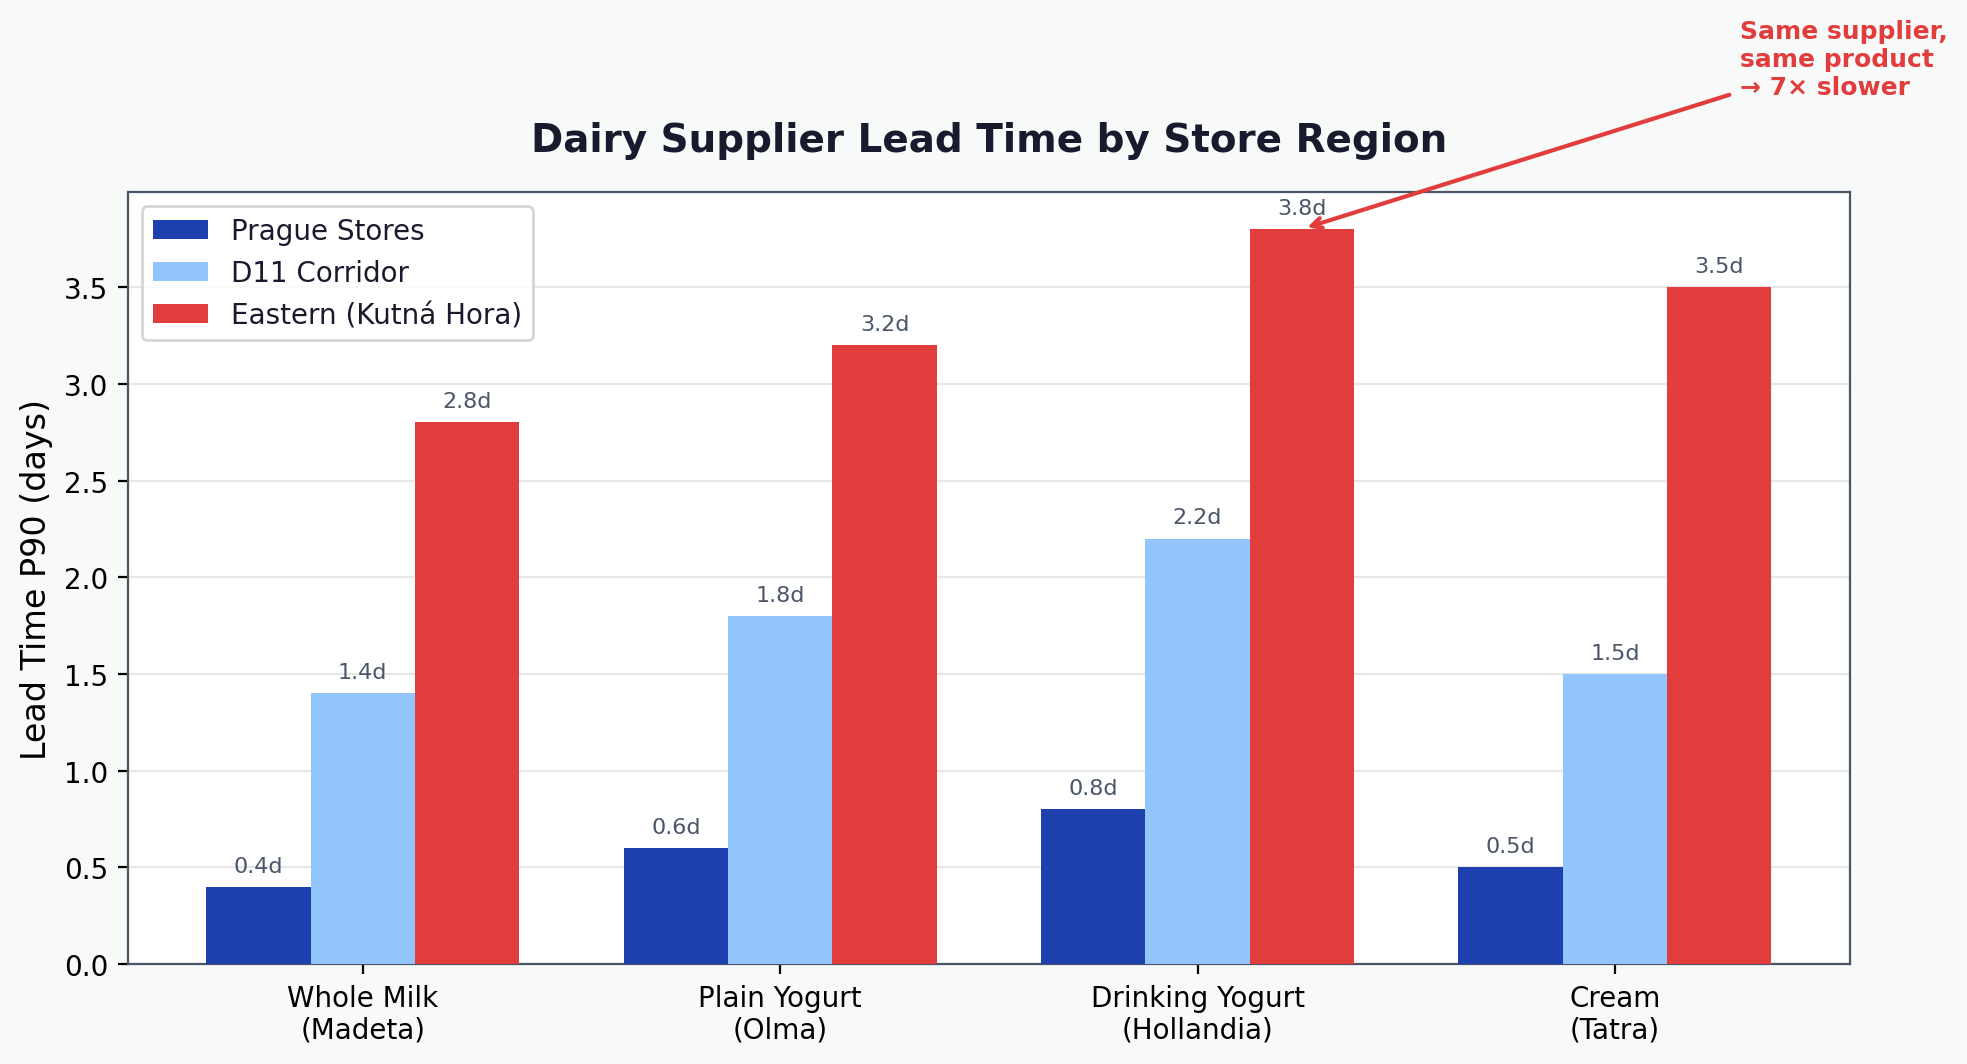
Prague-area stores received fresh dairy within hours (P90: 0.4 days). Stores along the D11 corridor had P90 of 1.4–2.2 days. Eastern stores near Kutná Hora reached 2.8–3.8 days at P90 — up to 7× slower than Prague for the same product from the same cooperative.
Store managers didn’t know any of this. Odoo had “2 days” for every location. For Prague, that was too conservative. For eastern stores, it was too optimistic.
Step 2: Per-Store Demand Velocity
We computed average daily demand per dairy SKU per store from 12 months of sales data. Demand ranged from 8 units/day (small store, flavored milk) to 120 units/day (large store, basic whole milk 1L). Yet the shared spreadsheet had min_qty=50 for milk across the board — over-stocking some stores and starving others.
Step 3: Shelf-Life-Constrained Reorder Points
The standard reorder point formula is min_qty = avg_daily_demand × lead_time_P90. But for perishables with 5–7 day shelf lives, there’s a hard ceiling: you cannot order more than the store can sell before the product expires.
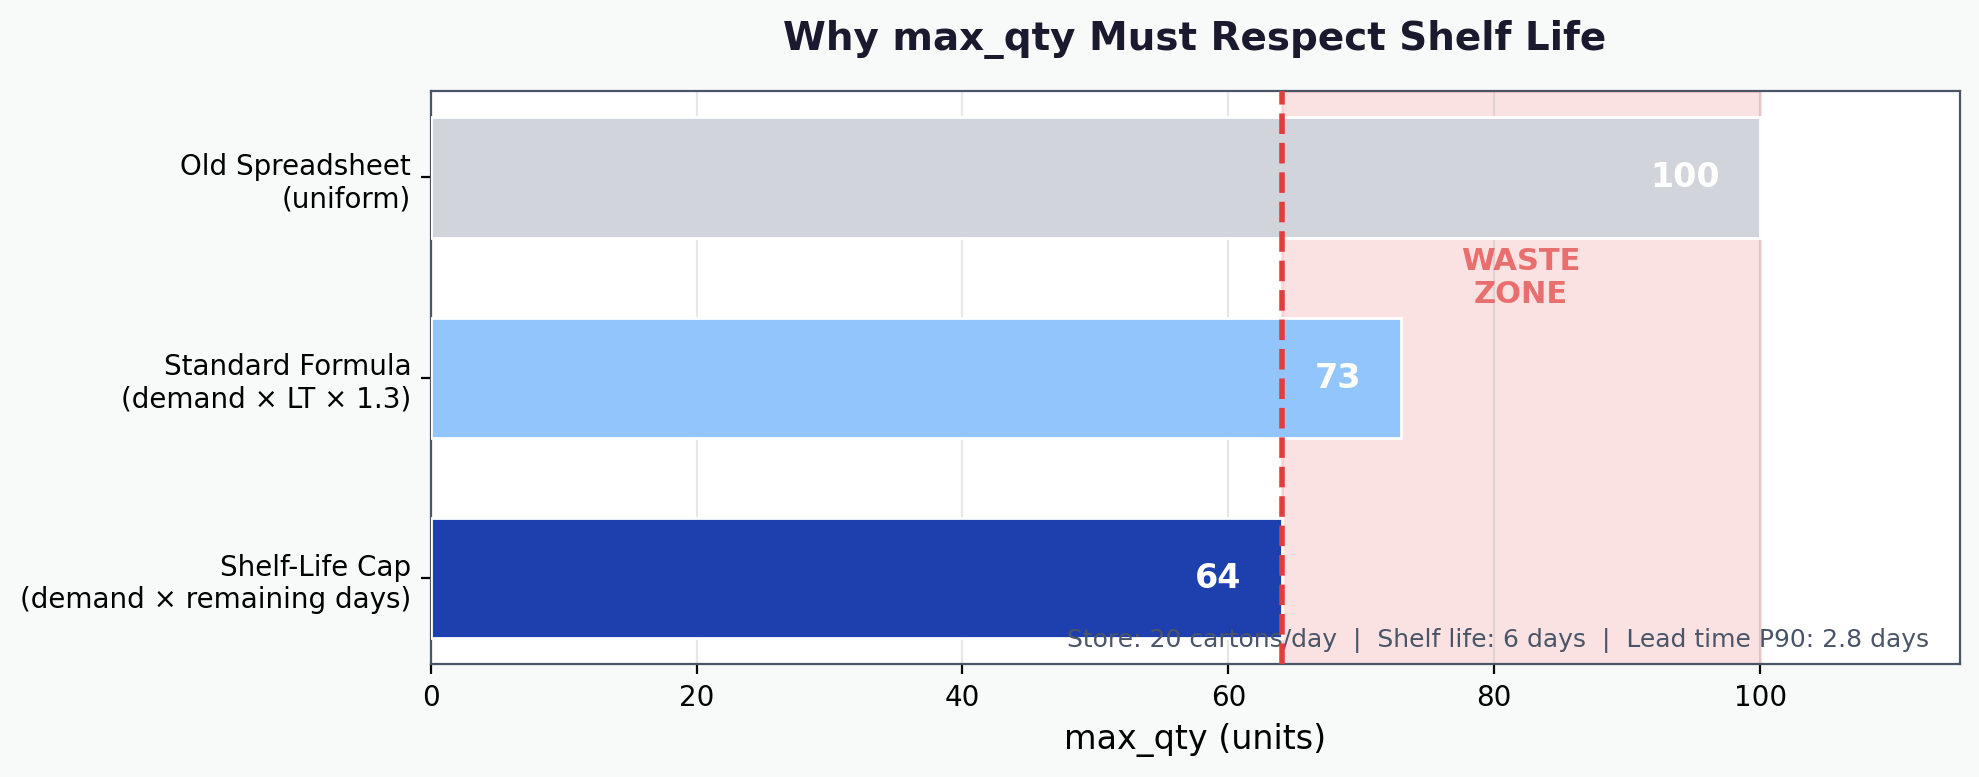
For a store selling 20 cartons/day of whole milk (shelf life 6 days, lead time P90 2.8 days): the spoilage ceiling caps max_qty at 64 units. The old spreadsheet had 100 — ordering 36 cartons more than the store could sell before expiry on every single order.
Step 4: Computed Reorder Points
We computed per-store, per-SKU reorder points that reflect each location’s actual demand velocity, supplier lead time distribution, and shelf-life constraint.
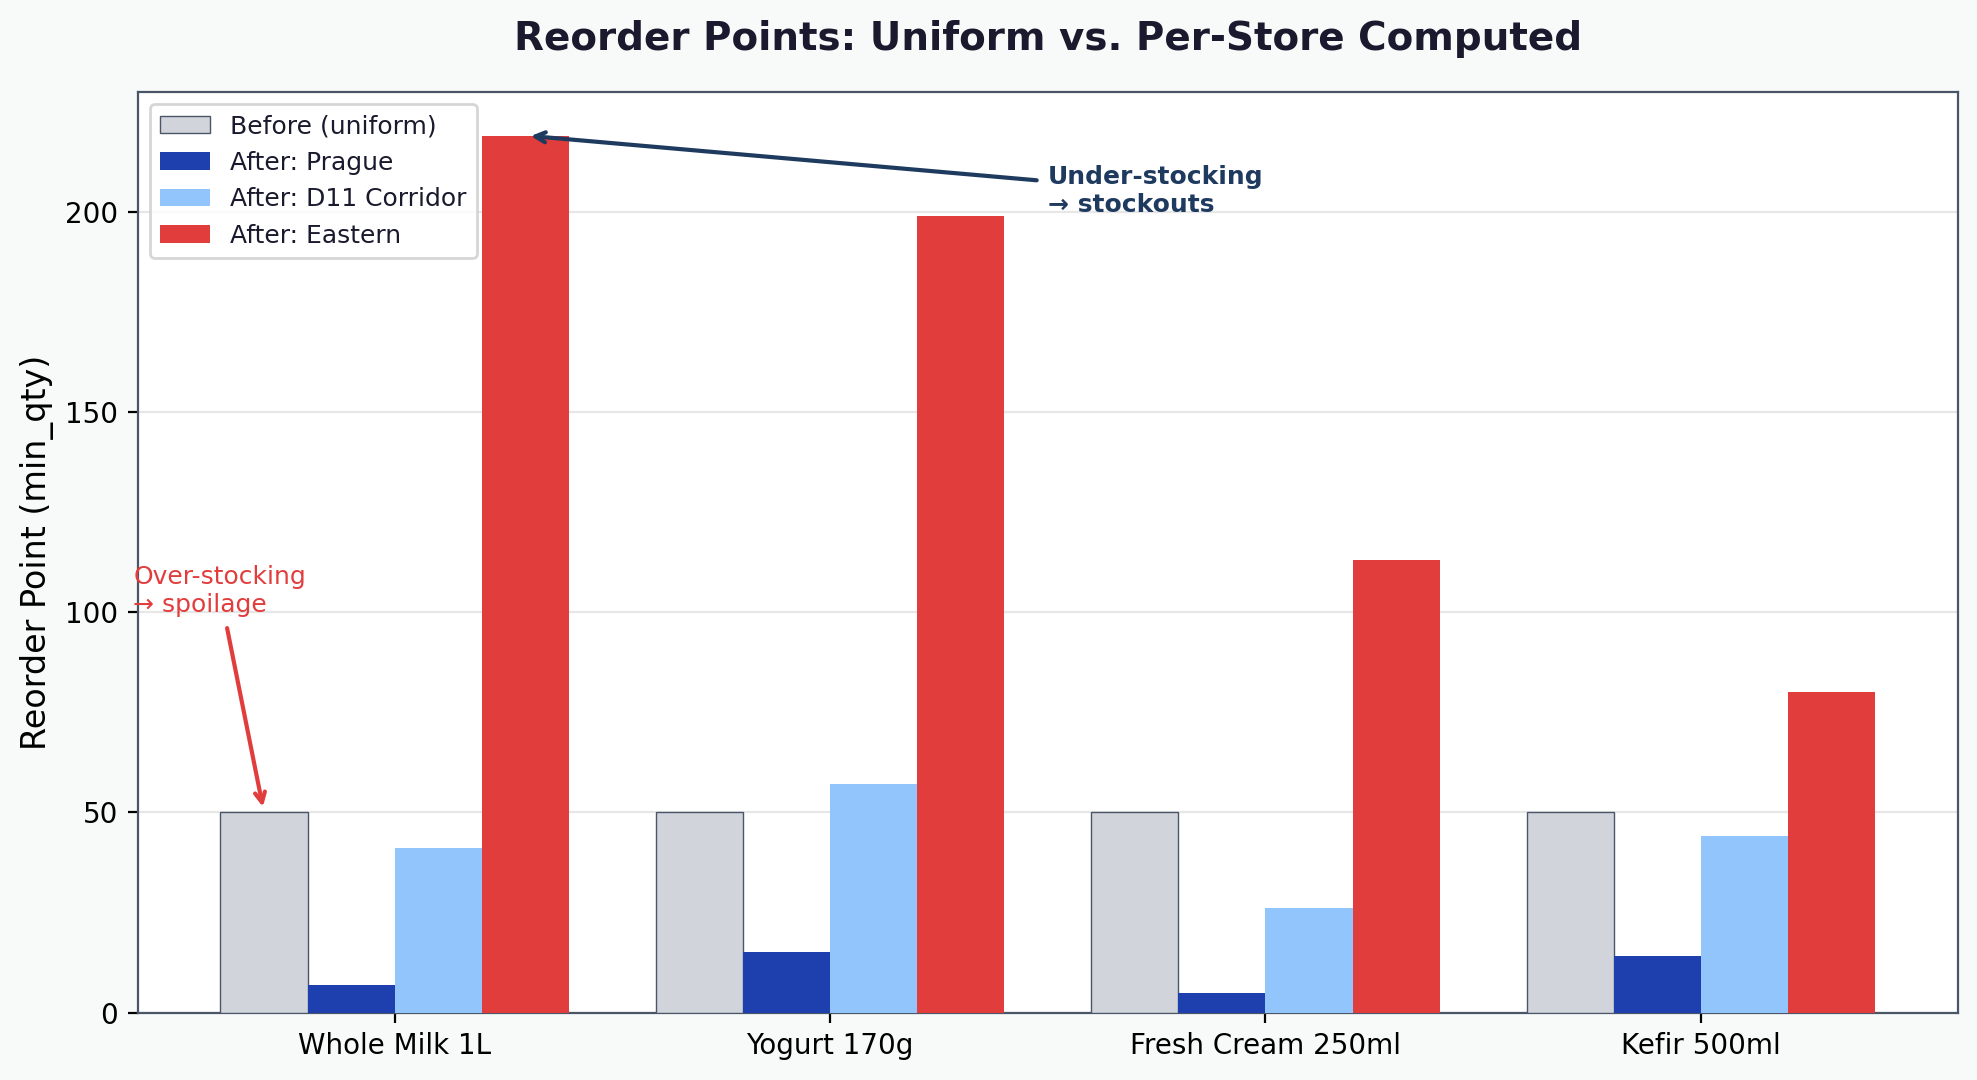
The same product gets a min_qty of 7 at a fast Prague store and 219 at a slow eastern store — because the lead times and demand justify it. The old uniform value of 50 was wrong for both: too high for Prague (spoilage), too low for the east (stockouts).
The Solution

Optimized product_min_qty and product_max_qty values are written directly to Odoo orderpoints via automated weekly sync. Each store gets location-specific rules. Lead times and demand are re-computed every Monday from the latest data; new reorder points are pushed to Odoo by Tuesday morning. Store managers can still override, but the system defaults to computed values.
Results
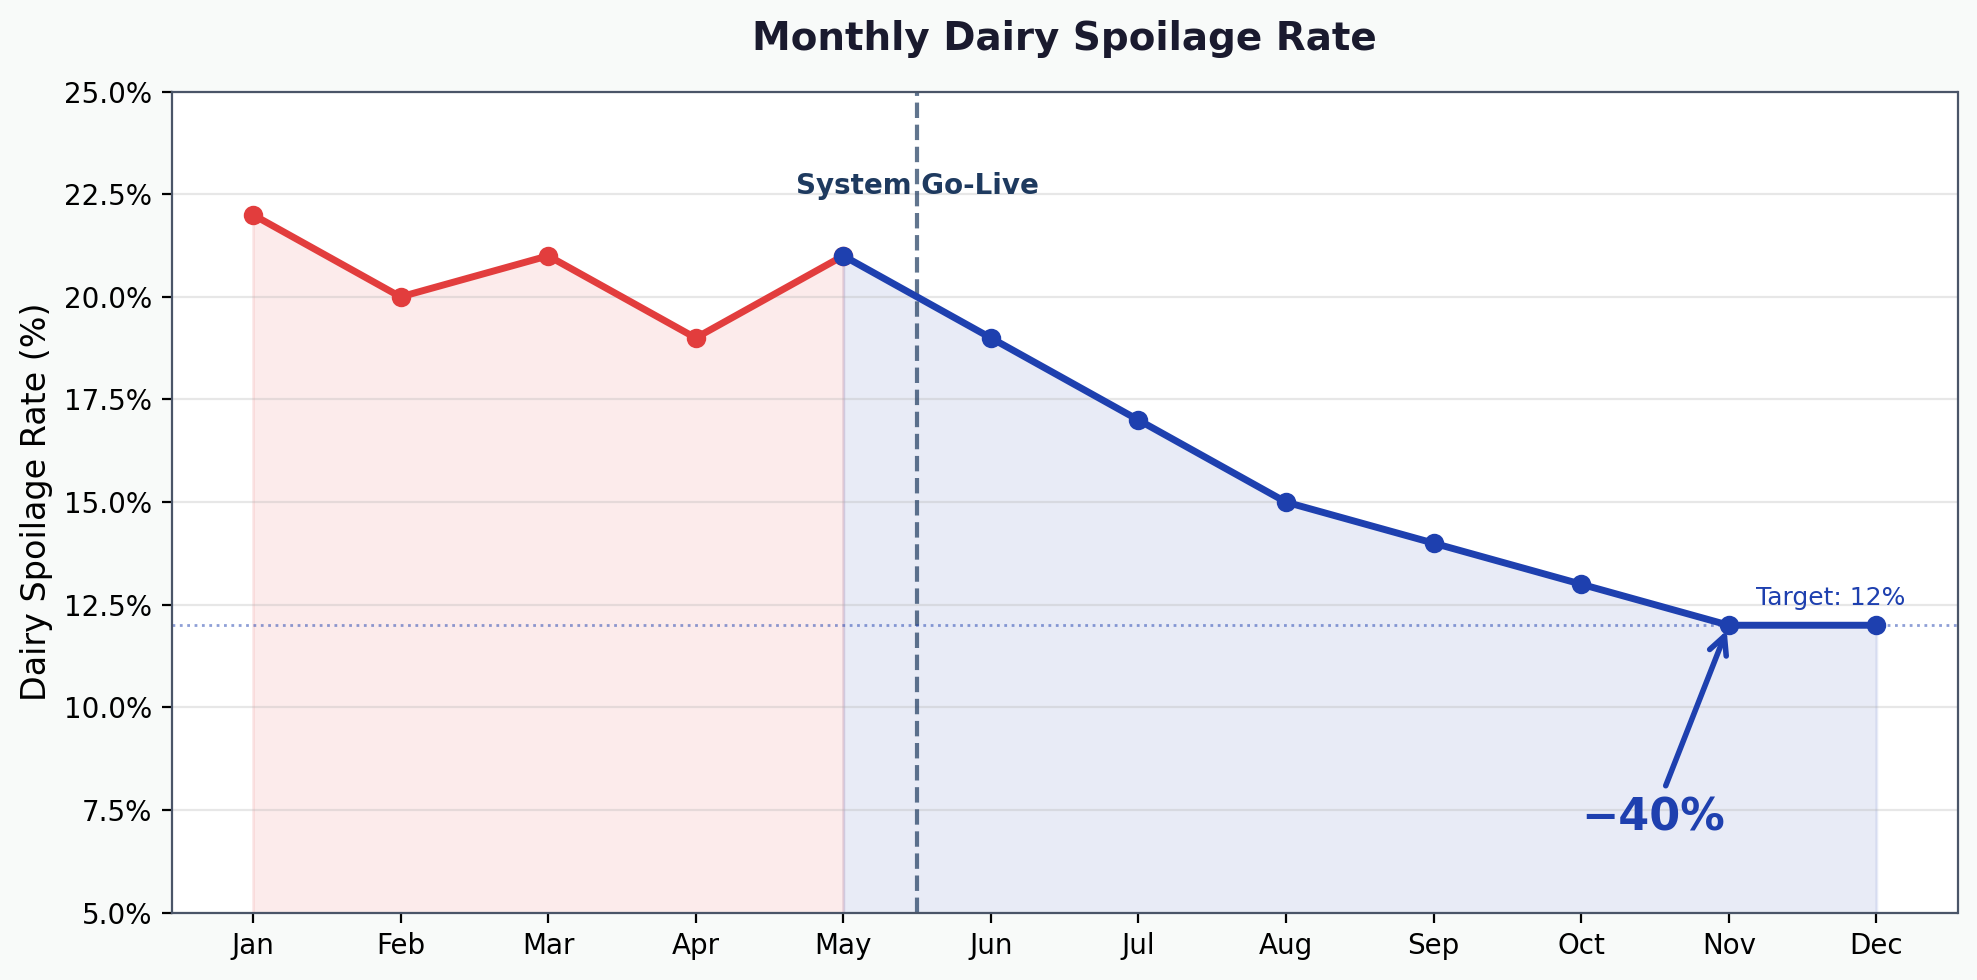
| Metric | Before | After | Change |
|---|---|---|---|
| Dairy spoilage rate | 21% | 12% | -40% |
| Stockout events (dairy/week) | 14 | 5.5 | -60% |
| Average dairy inventory value | baseline | 85% | -15% |
| Order frequency | unchanged | unchanged | quantities right-sized |
At approximately 2M CZK/month in dairy purchasing, reducing spoilage from 21% to 12% saved around 180K CZK per month — roughly 2.2M CZK per year.