The Forecast Nobody Expected: How Demand Predictions Became a Shift Planning Tool

We built a demand forecasting system to optimize inventory — reorder points, fill rates, working capital. It worked. But the most enthusiastic users weren’t the purchasing team. Warehouse operations managers adopted the same forecast data to plan shifts, and the “bonus” use case delivered half the total value: 1.1M CZK per year in labor cost savings.
The Setup
A mid-size distribution center operator in Czechia, running 3 warehouse locations handling FMCG, fresh, and ambient goods. Around 20,000 active SKUs, 150+ warehouse staff across shifts and locations (pickers, receivers, put-away crew, supervisors), all managed through Odoo.
We deployed our standard system: per-SKU per-location demand velocity, lead time distributions, computed min/max for Odoo orderpoints. The goal was inventory optimization. Fill rates went up, excess stock came down.
The Surprise

Within weeks of go-live, warehouse operations managers became the heaviest consumers of the forecast data. They weren’t looking at reorder points or service levels. They were looking at aggregated daily demand volume by location — and using it to plan shifts.
The problem they’d been solving manually every week: how many pickers, receivers, and put-away crew to allocate per shift per location. Too few on a high-volume day means overtime, delayed shipments, SLA breaches. Too many on a slow day means idle workers and wasted payroll.
Previously, this was done by gut feel and last year’s calendar. The big peaks — Black Friday, back-to-school — were known. But mid-week fluctuations, supplier delivery clustering, and gradual seasonal ramps were invisible until the trucks showed up.
What They Discovered
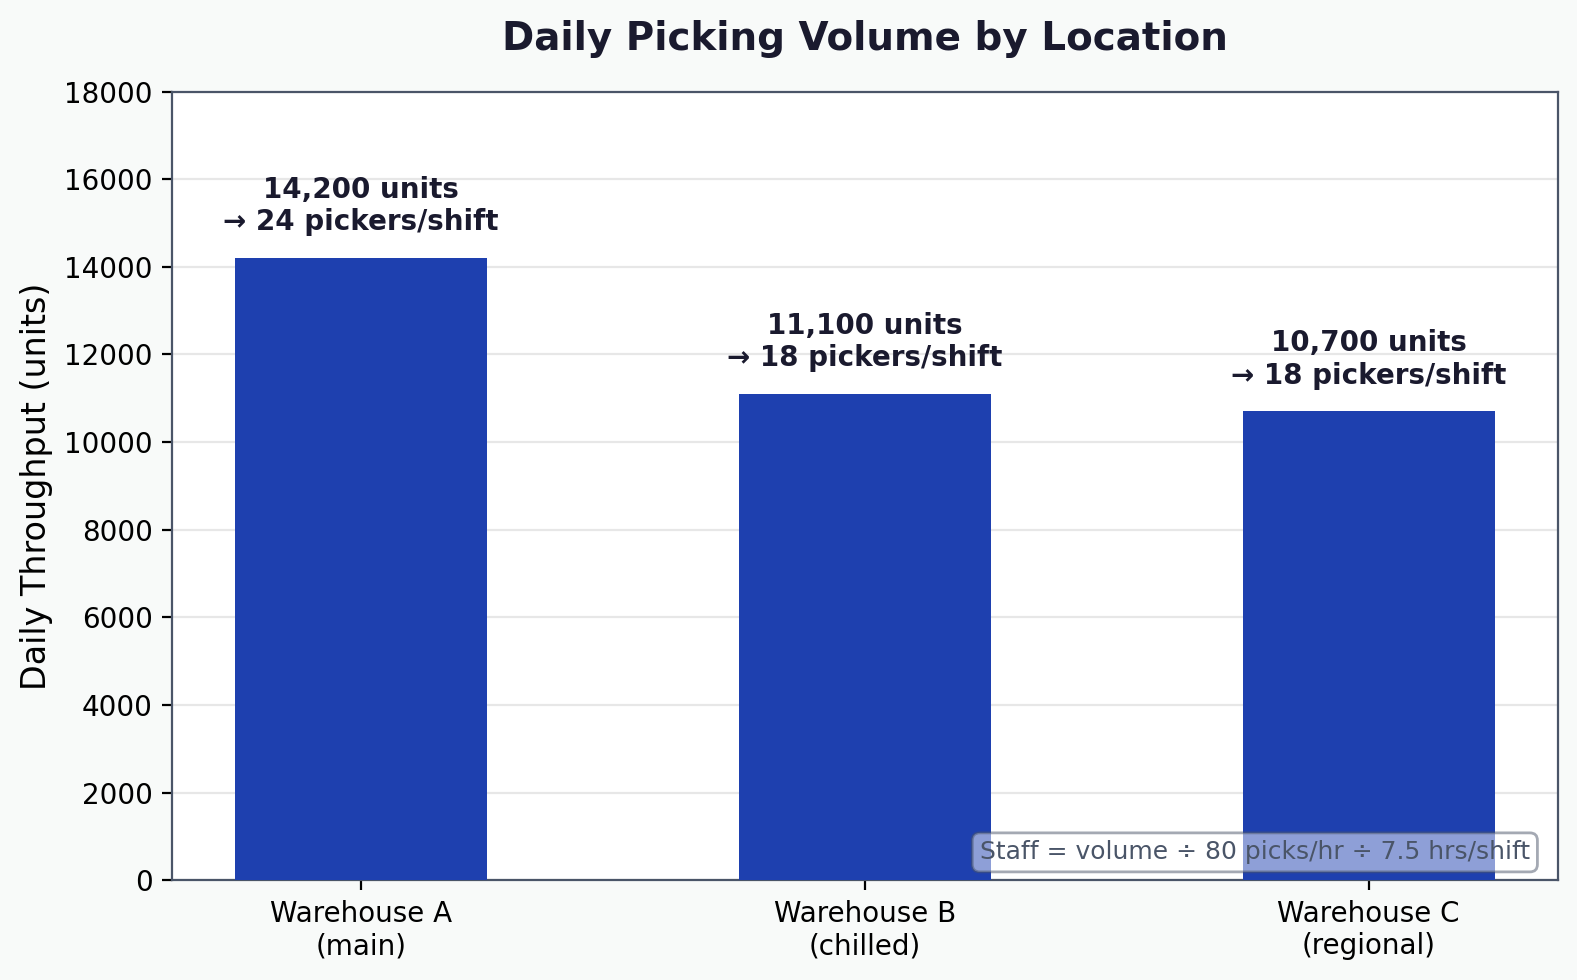
The demand forecast, aggregated from SKU-level to location-level daily volume, gave operations managers something they’d never had: a 2–4 week forward view of expected warehouse throughput.
On the inbound side: reorder points trigger purchase orders, and purchase orders have expected delivery dates. Aggregating all open POs by receipt date predicts which days will have heavy receiving volume and which will be light. On the outbound side: the demand forecast itself predicts daily picking volume per location, including day-of-week patterns and seasonal ramps visible weeks ahead.
The operations manager applied simple multipliers: ~120 units/hour per worker for receiving, ~80 units/hour for picking, 7.5 productive hours per shift. At one location, a peak day expecting 18,000 outbound picks needs 30 pickers. A light day with 8,000 picks needs 13. Previously, they scheduled a flat 20 pickers every day regardless of volume.
Flat Staffing vs. Forecast-Driven
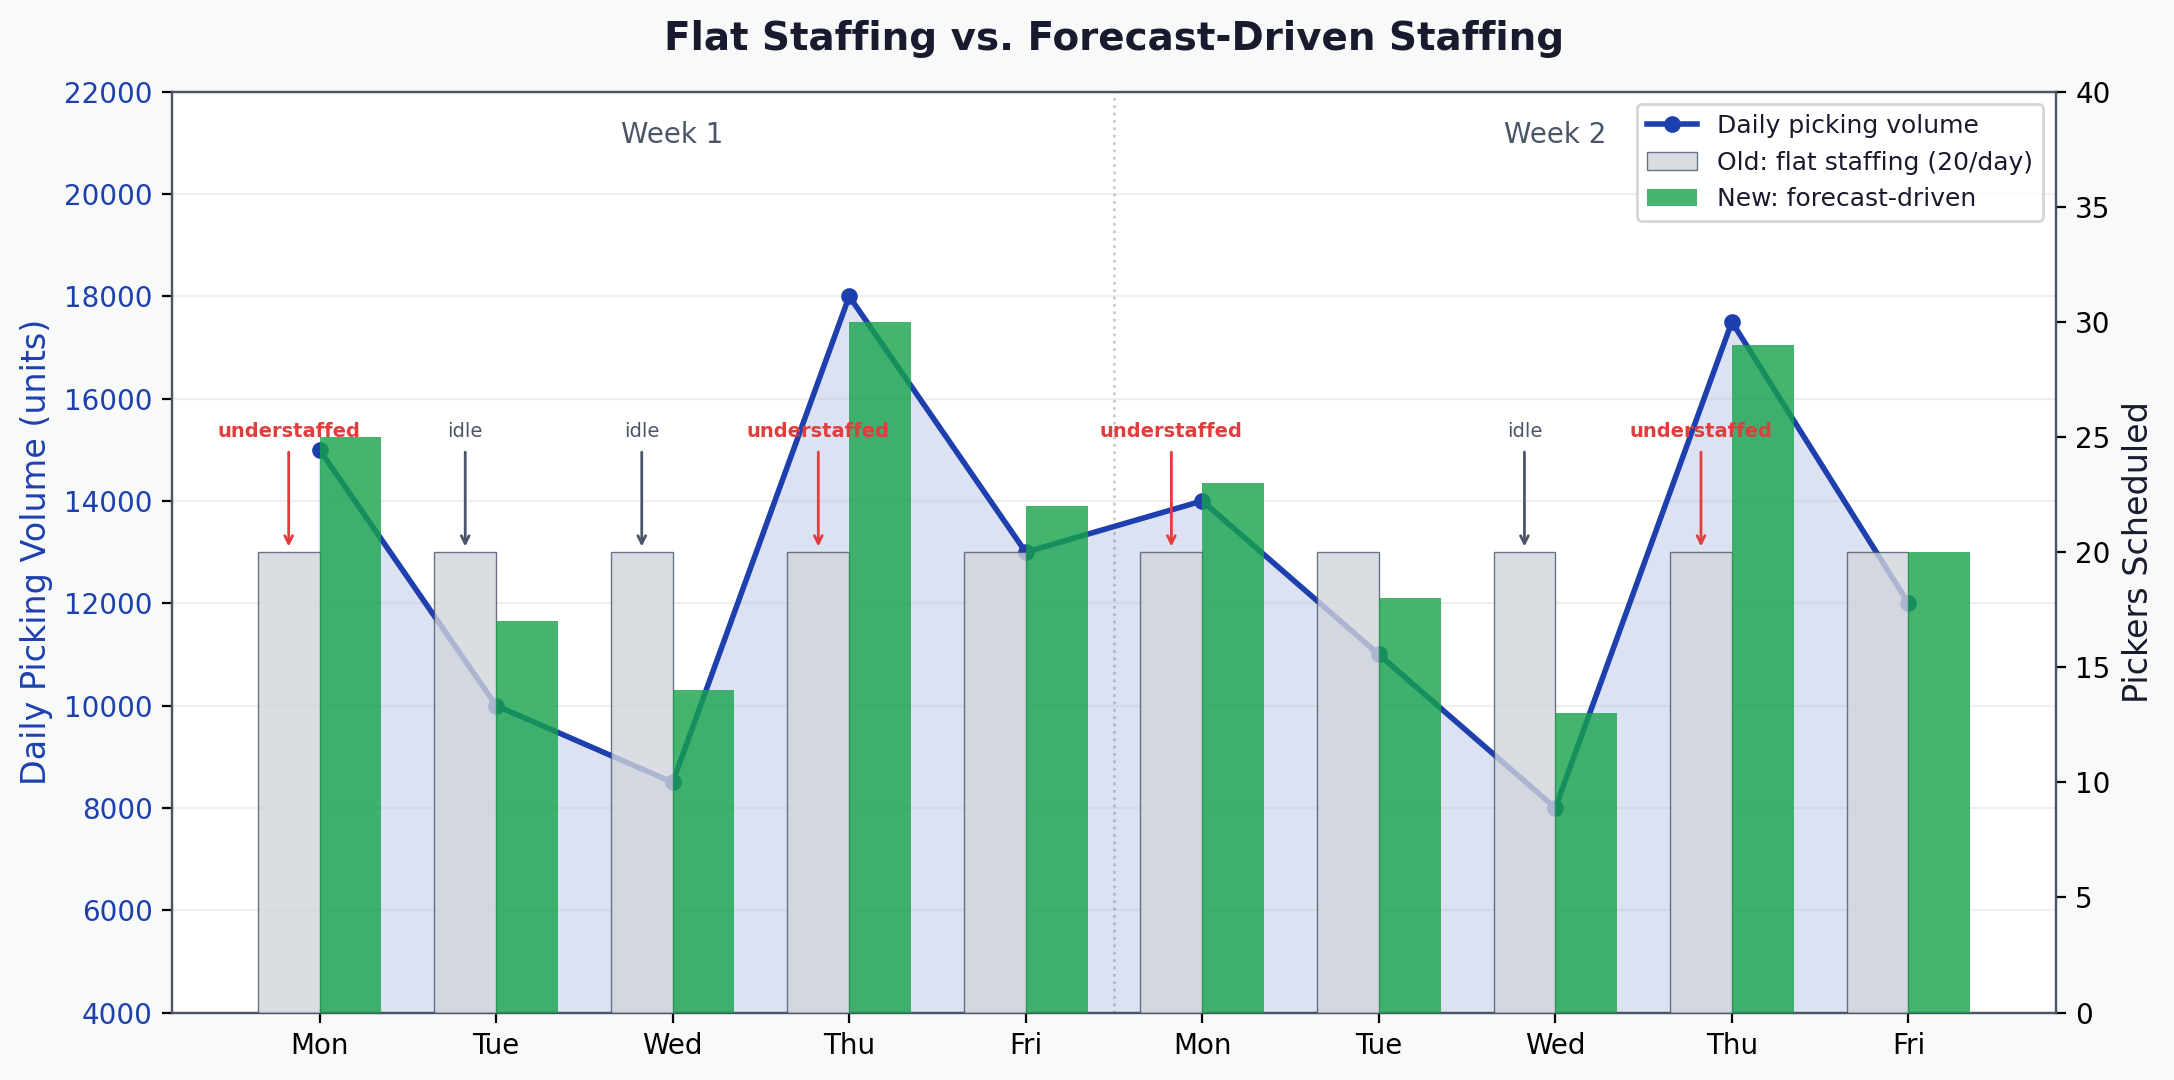
The chart tells the story. With flat staffing, peak Thursdays were understaffed (overtime, delays) and quiet Wednesdays were overstaffed (idle workers). The demand forecast made the pattern visible and actionable two weeks ahead. Staff are now adjusted ±30% based on rolling forecasts. Peak days get pre-booked temp workers at standard agency rates instead of last-minute overtime at 125%.
The Numbers
| Metric | Before | After | Change |
|---|---|---|---|
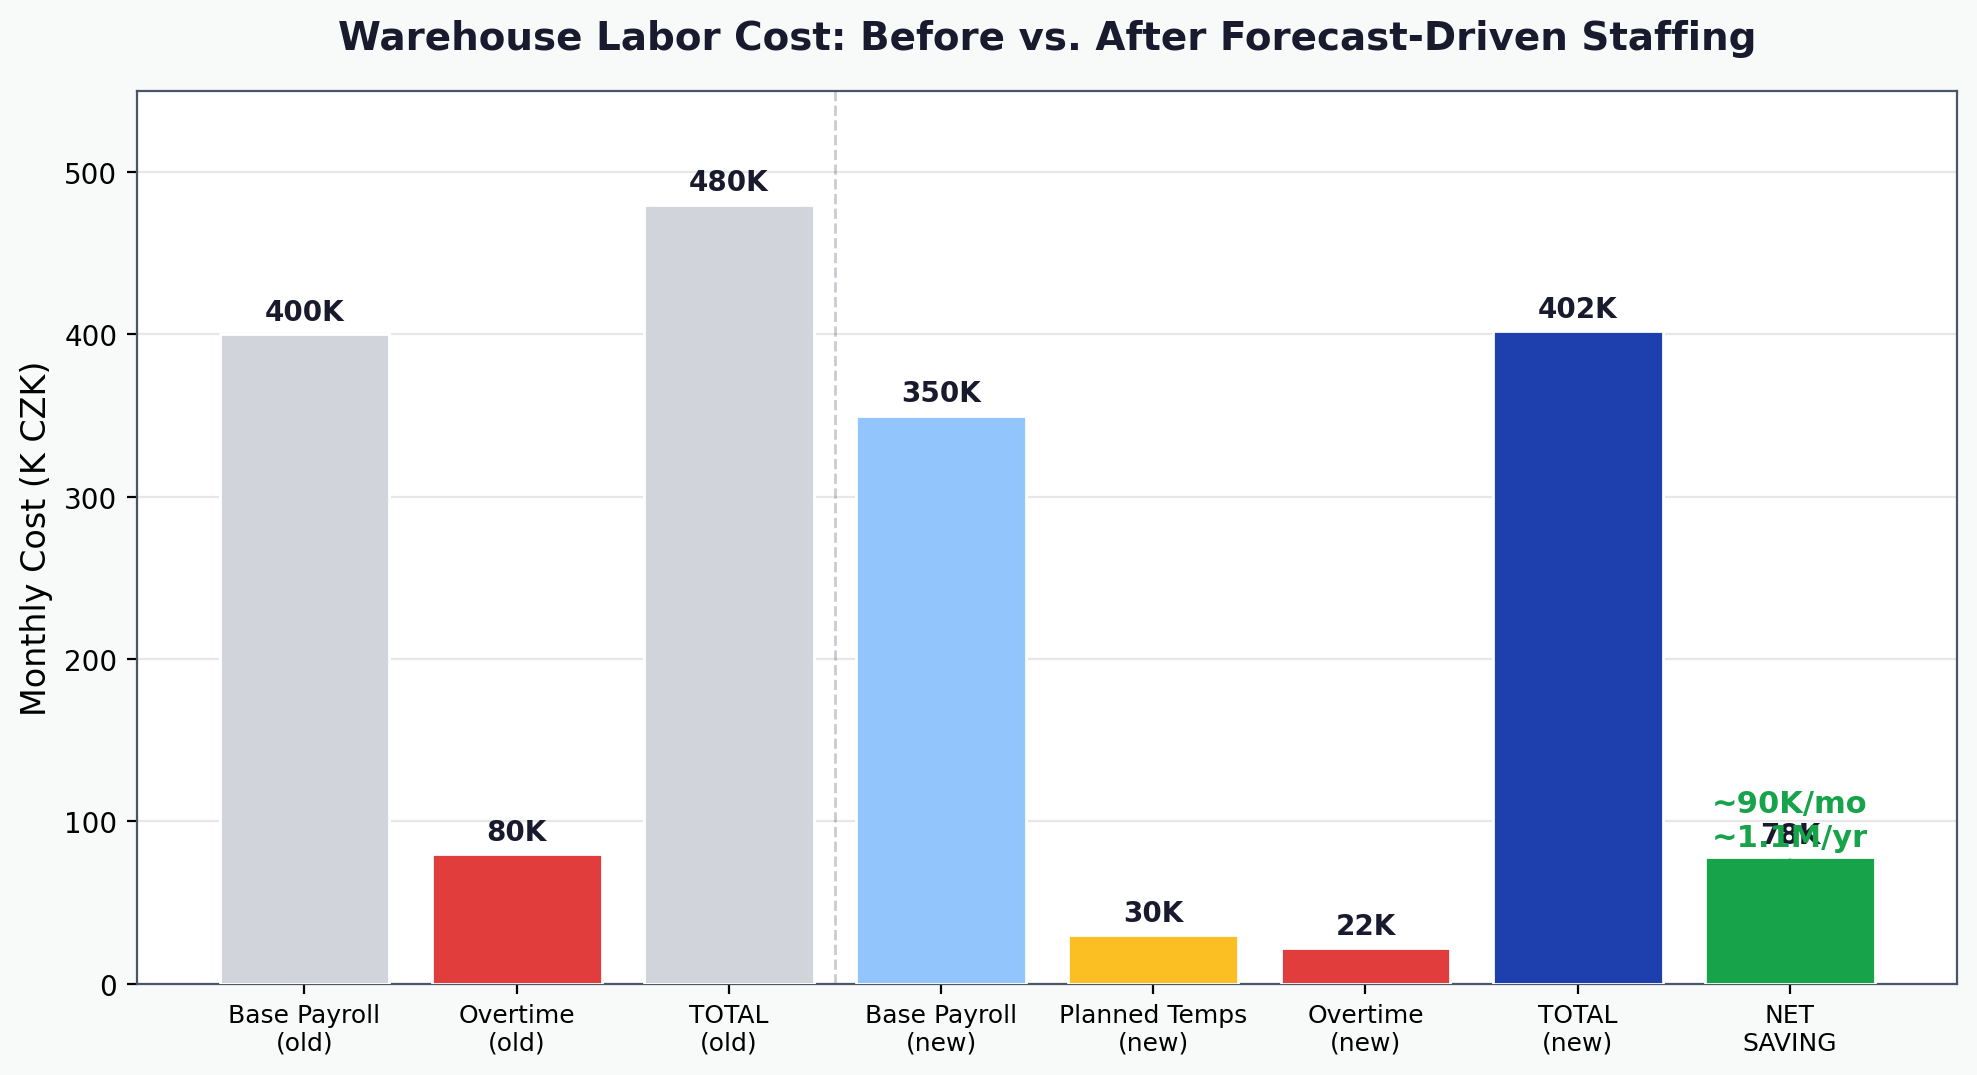
| Overtime hours / month | 320 hrs | 90 hrs | -72% |
| Overtime cost / month | 80K CZK | 22K CZK | -72% |
| Idle worker-hours / month | 200 hrs | 60 hrs | -70% |
| SLA breaches from understaffing | 3–4 / month | 0–1 / month | -80% |
| Temp worker rate (emergency vs. planned) | 450 CZK/hr | 320 CZK/hr | -29% |
| Net labor cost saving / month | — | ~90K CZK | ~1.1M CZK/year |
The Punchline
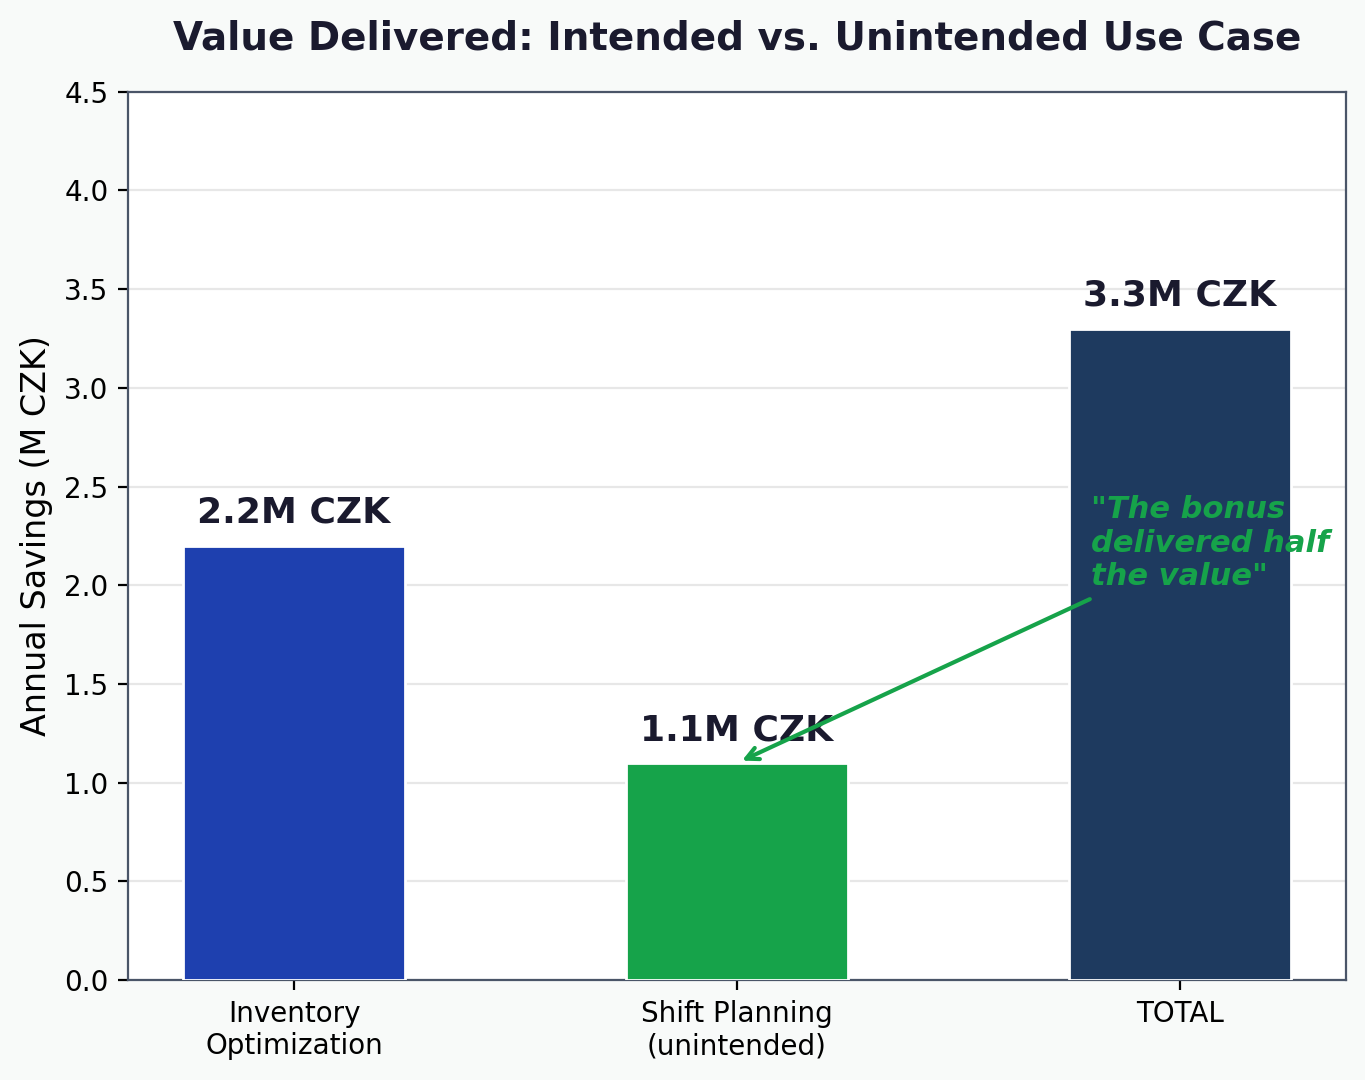
The inventory optimization saved approximately 2.2M CZK per year in reduced stockouts and excess inventory. The shift planning — an entirely unintended side effect — saved another 1.1M CZK per year in labor costs. The bonus use case delivered half the value of the primary one, at zero additional implementation cost.
Why This Matters
- Forecasts are infrastructure. A demand forecast built for one purpose (reorder points) becomes a platform for other decisions — labor, transport, capacity. The marginal cost of the second use case is near zero.
- Warehouse managers think in shifts, not SKUs. The purchasing team wants per-SKU min/max. The ops manager wants “how many people do I need next Thursday.” Same data, different aggregation.
- The best adoption comes from solving daily pain. The ops manager adopted the system faster than purchasing because shift planning was a daily pain point with immediate feedback. Over-staff today and you see idle workers. Under-staff and you see overtime slips that evening.
- Simple multipliers on good data beat complex models on bad data. The ops manager’s “80 picks per hour” rule of thumb applied to an accurate demand forecast outperformed any workforce management tool running on gut-feel volume estimates.