Filling Empty Shelves: How a Northern Bohemia 3PL Lifted Warehouse Utilization from 58% to 84%

Half-empty warehouses. Constant stockouts. Clients leaving. The paradox: 58% utilization with 85% fill rate against a 95% SLA target. The root cause wasn’t lack of space — it was bulky slow-movers hogging it. Space-constrained service level optimization freed 2,800 m³, lifted fill rates to 96%, and deferred a 12M CZK warehouse expansion.
The Client
A third-party logistics operator based near Ústí nad Labem in northern Czechia. Two warehouses: 8,000 m² ambient and 5,000 m² multi-temperature with a chilled zone. Around 15,000 active SKUs across FMCG, household, and retail — serving 6 major clients with SLA commitments on fill rate. Inventory and replenishment managed in Odoo.
The Paradox: Empty Space, Empty Shelves

Overall warehouse utilization hovered at 58%, yet clients regularly complained about stockouts and missed SLAs. Fill rates ran 82–88% against a 95% target. Two clients left in the past year citing poor service.
The root cause was spatial misallocation. The warehouse manager allocated space by product category, not by velocity or value. Palletized bottled water occupied 22% of the ambient warehouse but turned over once every 45 days. Meanwhile, fast-moving dairy and beverage SKUs had 3–4 days of stock and constant replenishment failures.
Step 1: Space vs. Value Mapping
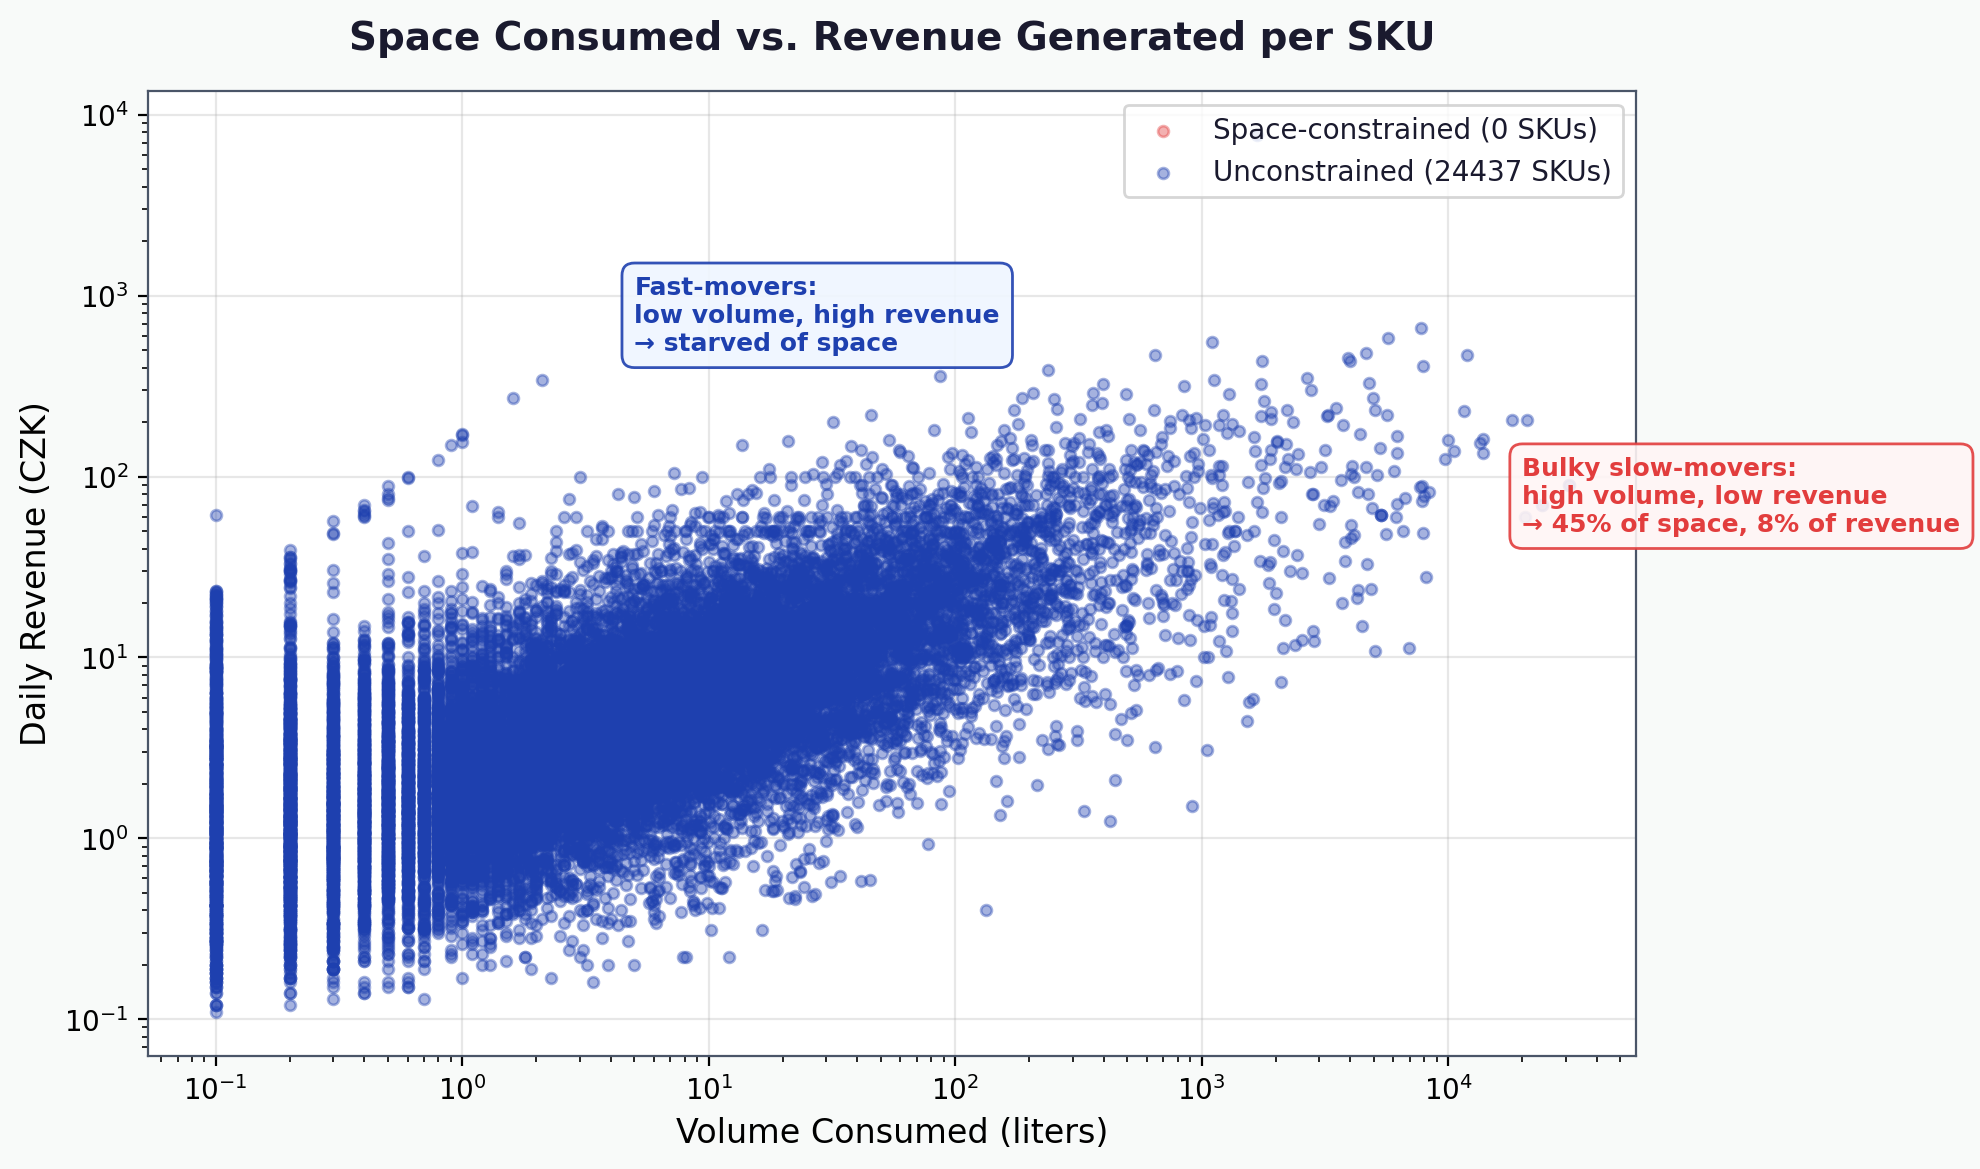
We mapped every SKU to cubic meters consumed, daily throughput, and revenue per cubic meter per day. The finding: 12% of SKUs consumed 45% of total warehouse volume but contributed only 8% of throughput revenue. The top offenders were 24-pack water pallets (3.2 m³ each, 40-day turnover), bulk detergent drums (2.8 m³, 55-day turnover), and toilet paper mega-packs (4.1 m³, 35-day turnover). Chilled dairy generated 6× more revenue per m³ but was allocated only 15% of chilled zone capacity.
Step 2: Lead Time Distributions
We built empirical lead time profiles from 2 years of inbound PO data. Local FMCG suppliers delivered in 2–5 days (P90: 5 days). Import non-food (detergent, paper) took 25–60 days (P90: 55 days). Import beverages ranged 30–90 days (P90: 80 days). Long lead times on imports forced high safety stock levels — which consumed space disproportionately.
Step 3: Space-Constrained Service Levels
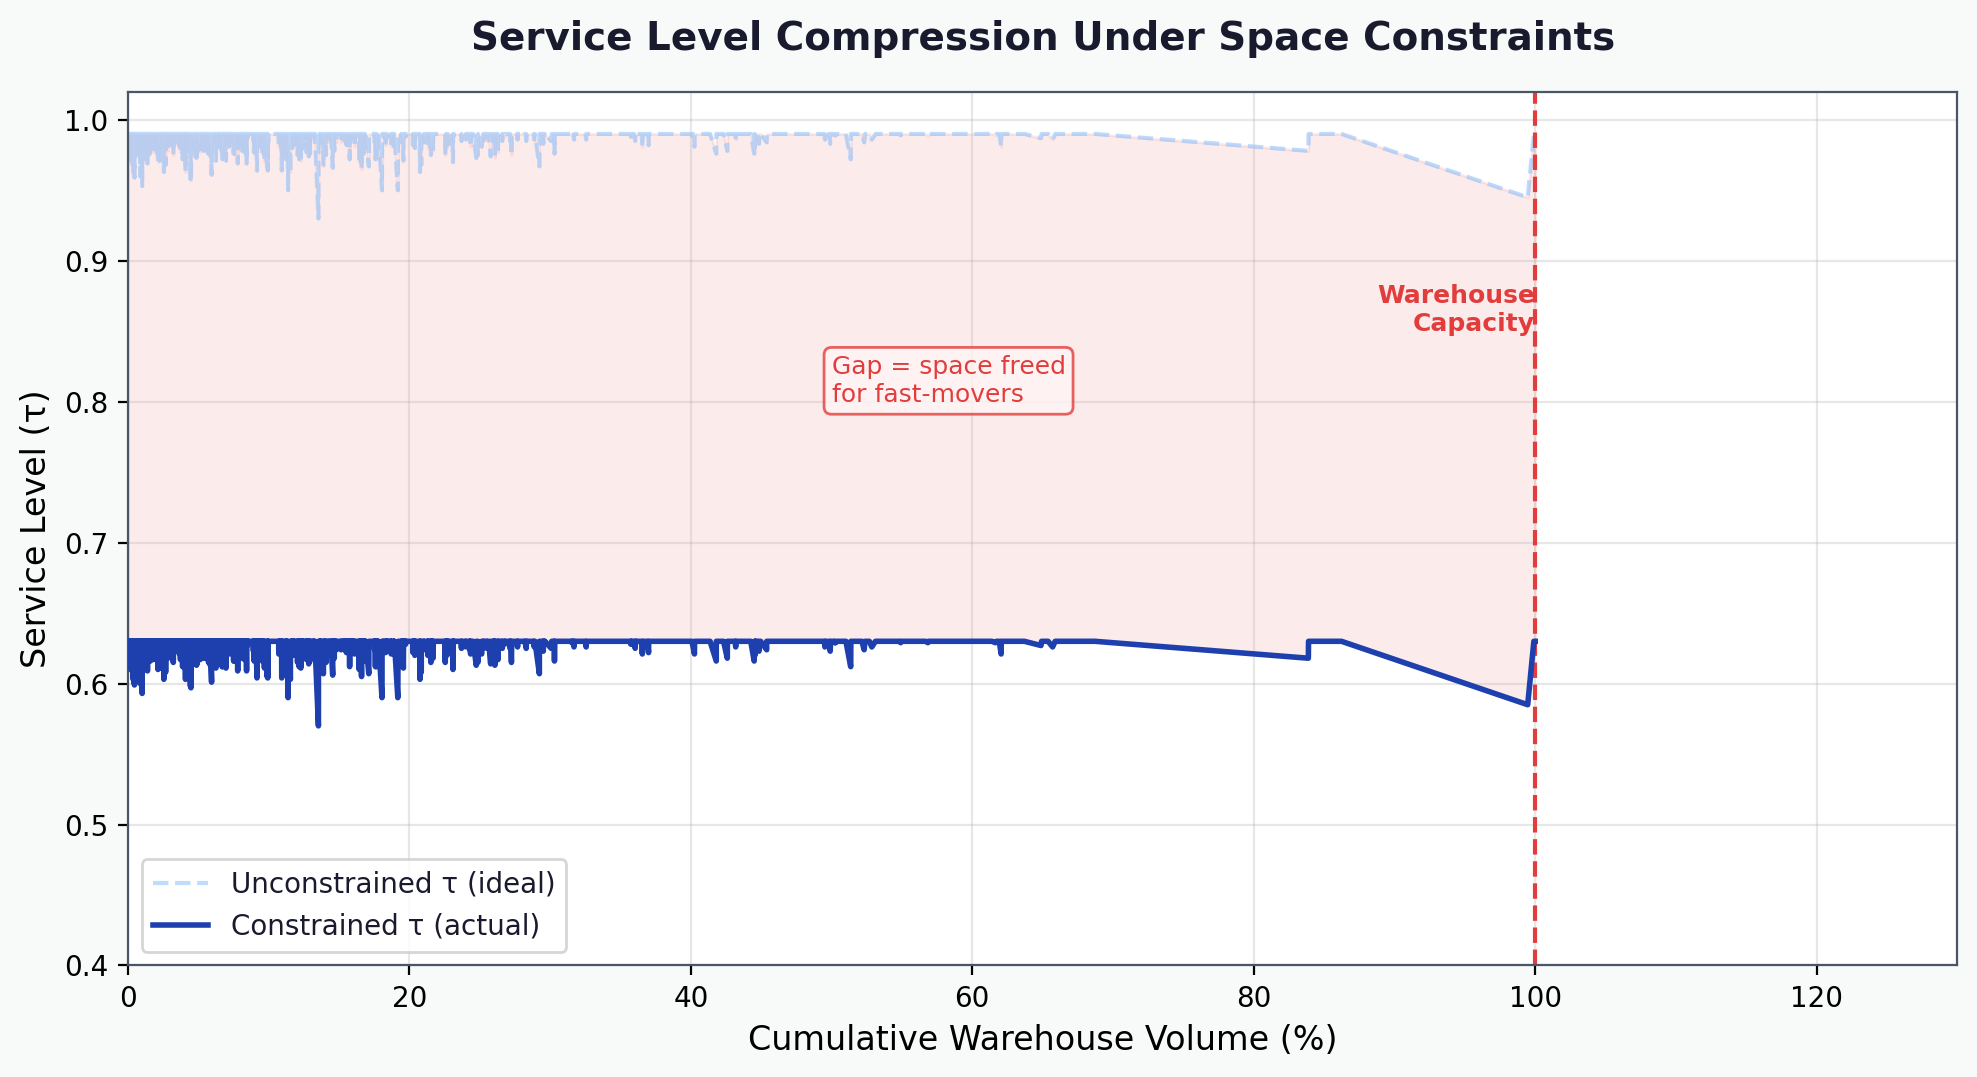
We computed the economically optimal service level (τ) per SKU, then applied warehouse capacity constraints. Both a fast-moving snack (τ = 0.99) and a bulky water pallet (τ = 0.98) want high service. But when total required volume exceeds warehouse capacity, the optimizer deliberately reduces τ for the lowest-marginal-value SKUs first.
Bulky imports had τ reduced from 0.93–0.98 down to 0.55–0.65, freeing approximately 2,800 m³ of warehouse space. High-velocity items kept τ at 0.95+. This is a conscious trade-off that no standard ERP computes automatically.
Step 4: Simulation
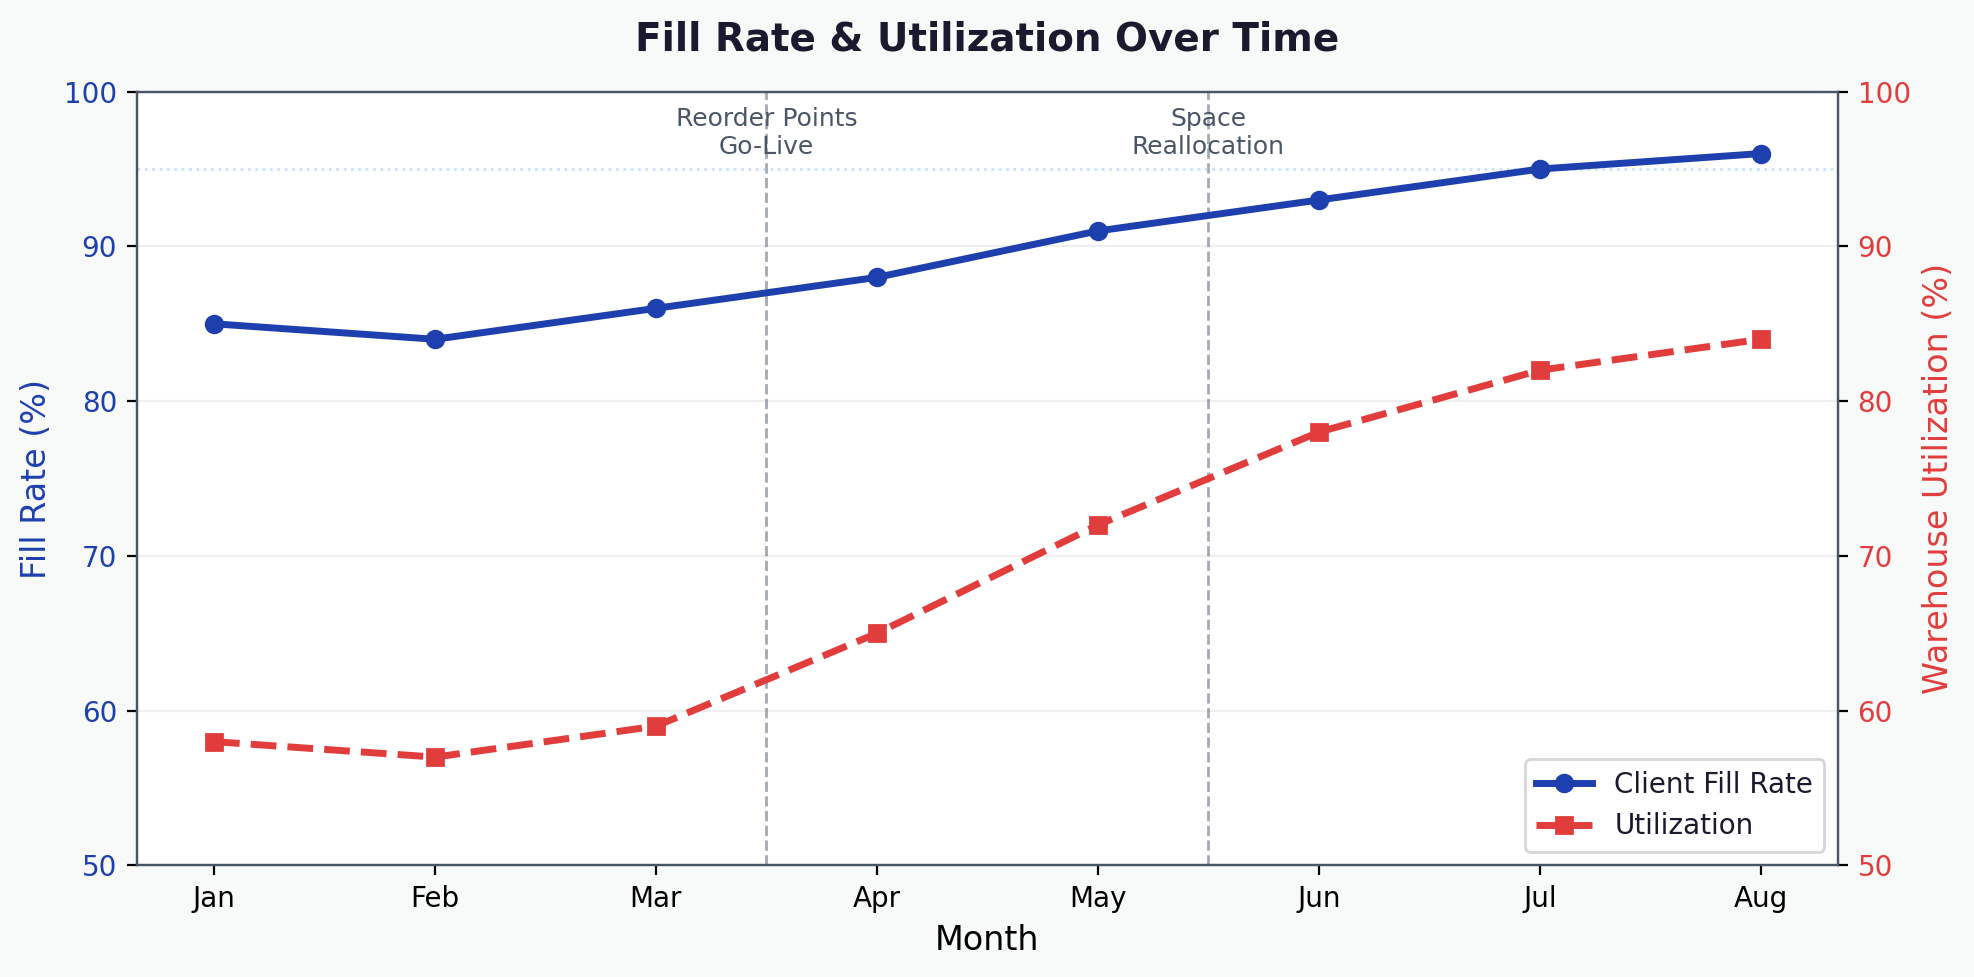
We simulated 6 months of operations under three policies. The status quo: 58% utilization, 85% fill rate. Optimized reorder points alone: 71% utilization, 91% fill rate. Optimized plus delist/relocate bulky slow-movers: 84% utilization, 96% fill rate. The third option relocated 800+ SKUs to rented on-site container storage at one-third the cost per m³, and delisted 200 SKUs with negative marginal contribution.
The Solution

Space-constrained reorder points for all 15,000 SKUs were written to Odoo orderpoints. The delist/relocate list was delivered with implementation priority: top 200 SKUs for immediate impact. Freed warehouse zones were reallocated: the chilled dairy section expanded by 40% and a dedicated fast-pick zone was created for the top 500 velocity SKUs. Service levels are recomputed weekly, adjusting automatically as demand patterns shift seasonally.
Results
| Metric | Before | After | Change |
|---|---|---|---|
| Warehouse utilization | 58% | 84% | +26 pp |
| Average client fill rate | 85% | 96% | +11 pp |
| Revenue per m³/month | baseline | 135% | +35% |
| Client stockout complaints/month | 22 | 10 | -55% |
| Contracts lost (trailing 12 months) | 2 | 0 | all retained |
Higher fill rates retained two at-risk client contracts worth approximately 4.5M CZK/year combined. Space optimization deferred a planned warehouse expansion estimated at 12M CZK in capital expenditure.