From Forecast to Floor Plan: Slotting a 15,000-SKU Warehouse with 3D Bin Packing
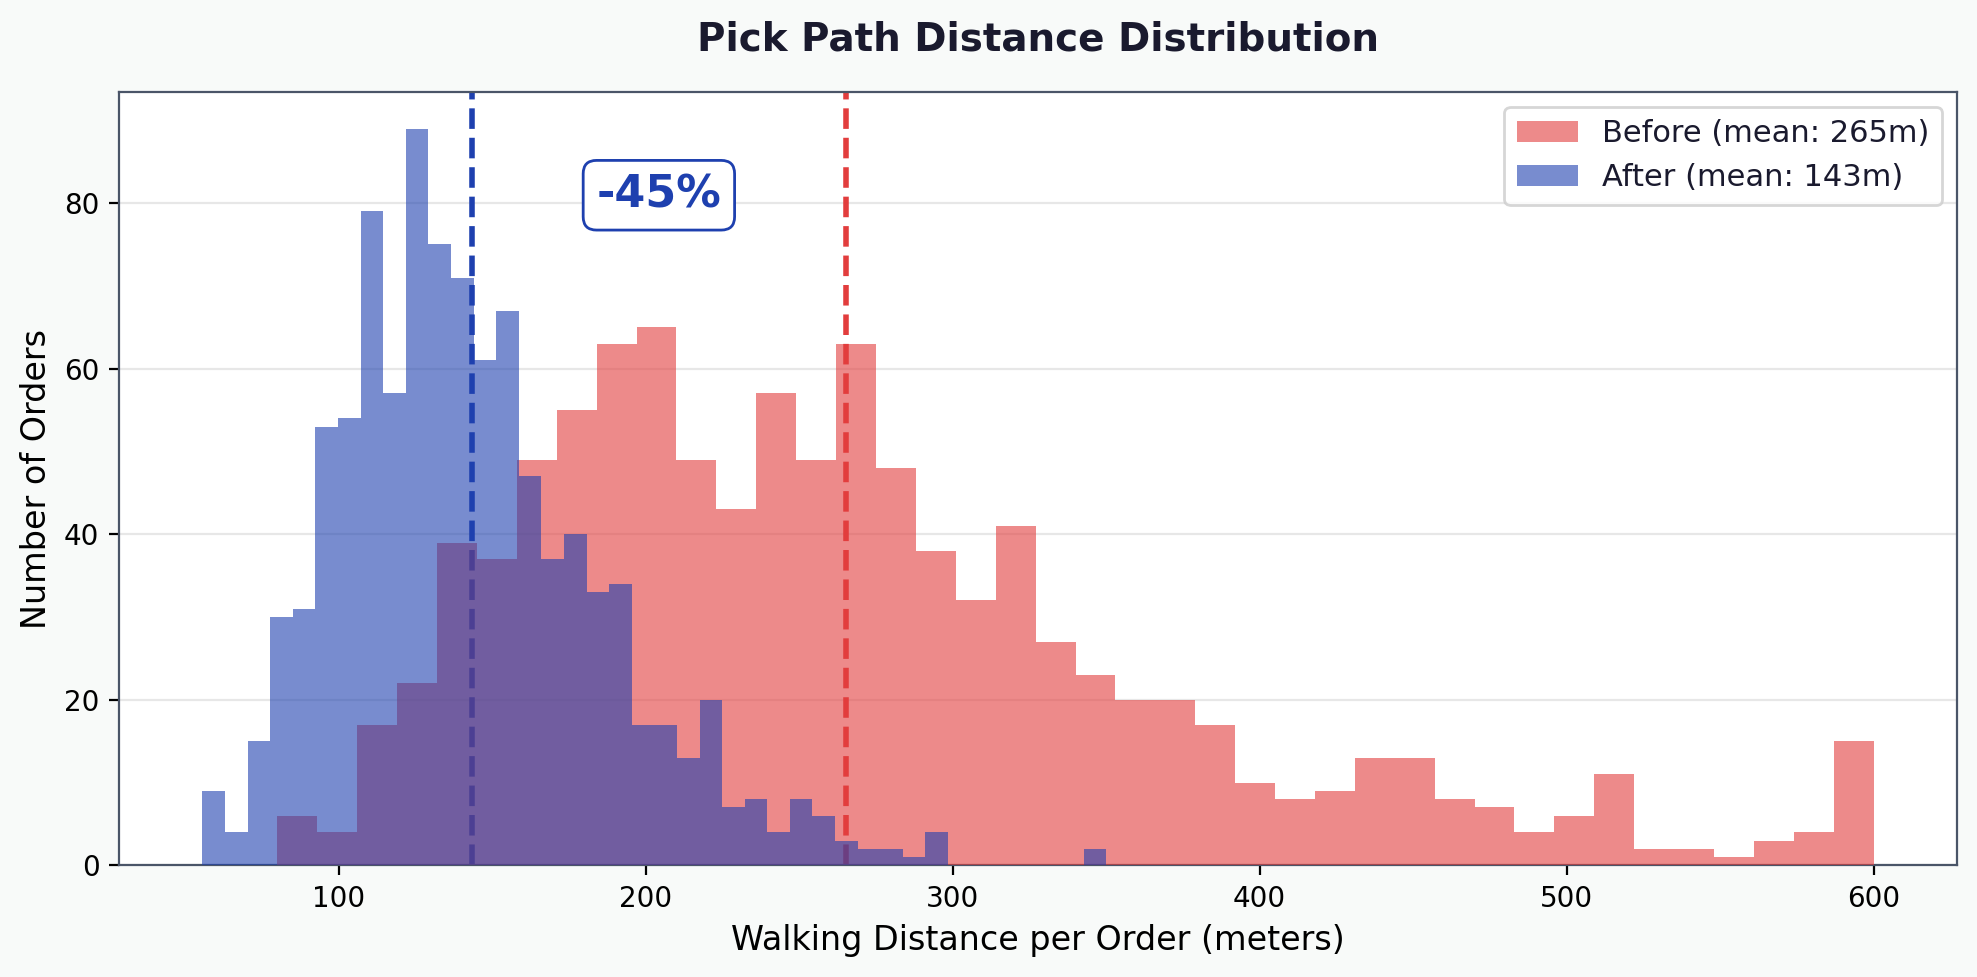
After optimizing what to stock and how much, the next question was where to put it. A Czech 3PL had solved fill rates but hit a pick productivity ceiling at 65 picks/hour. The root cause: 62% of picks came from 3% of SKUs — scattered across all 8 warehouse zones. Velocity-based slotting with 3D bin packing lifted picks to 94/hour and cut walking distance by 45%.
The Setup
This is a follow-up to our earlier engagement with a 3PL near Ústí nad Labem. That project solved the macro problem: which SKUs get how much space, and which move to overflow. Fill rates went from 85% to 96%.
But pick productivity plateaued at 65 picks per hour despite adequate staffing. The bottleneck shifted from stock availability to physical layout.
The Problem: Category-Based Slotting

The warehouse was slotted by product category — all dairy in zone B, all beverages in zone D, all household in zone F. This ignored three realities.
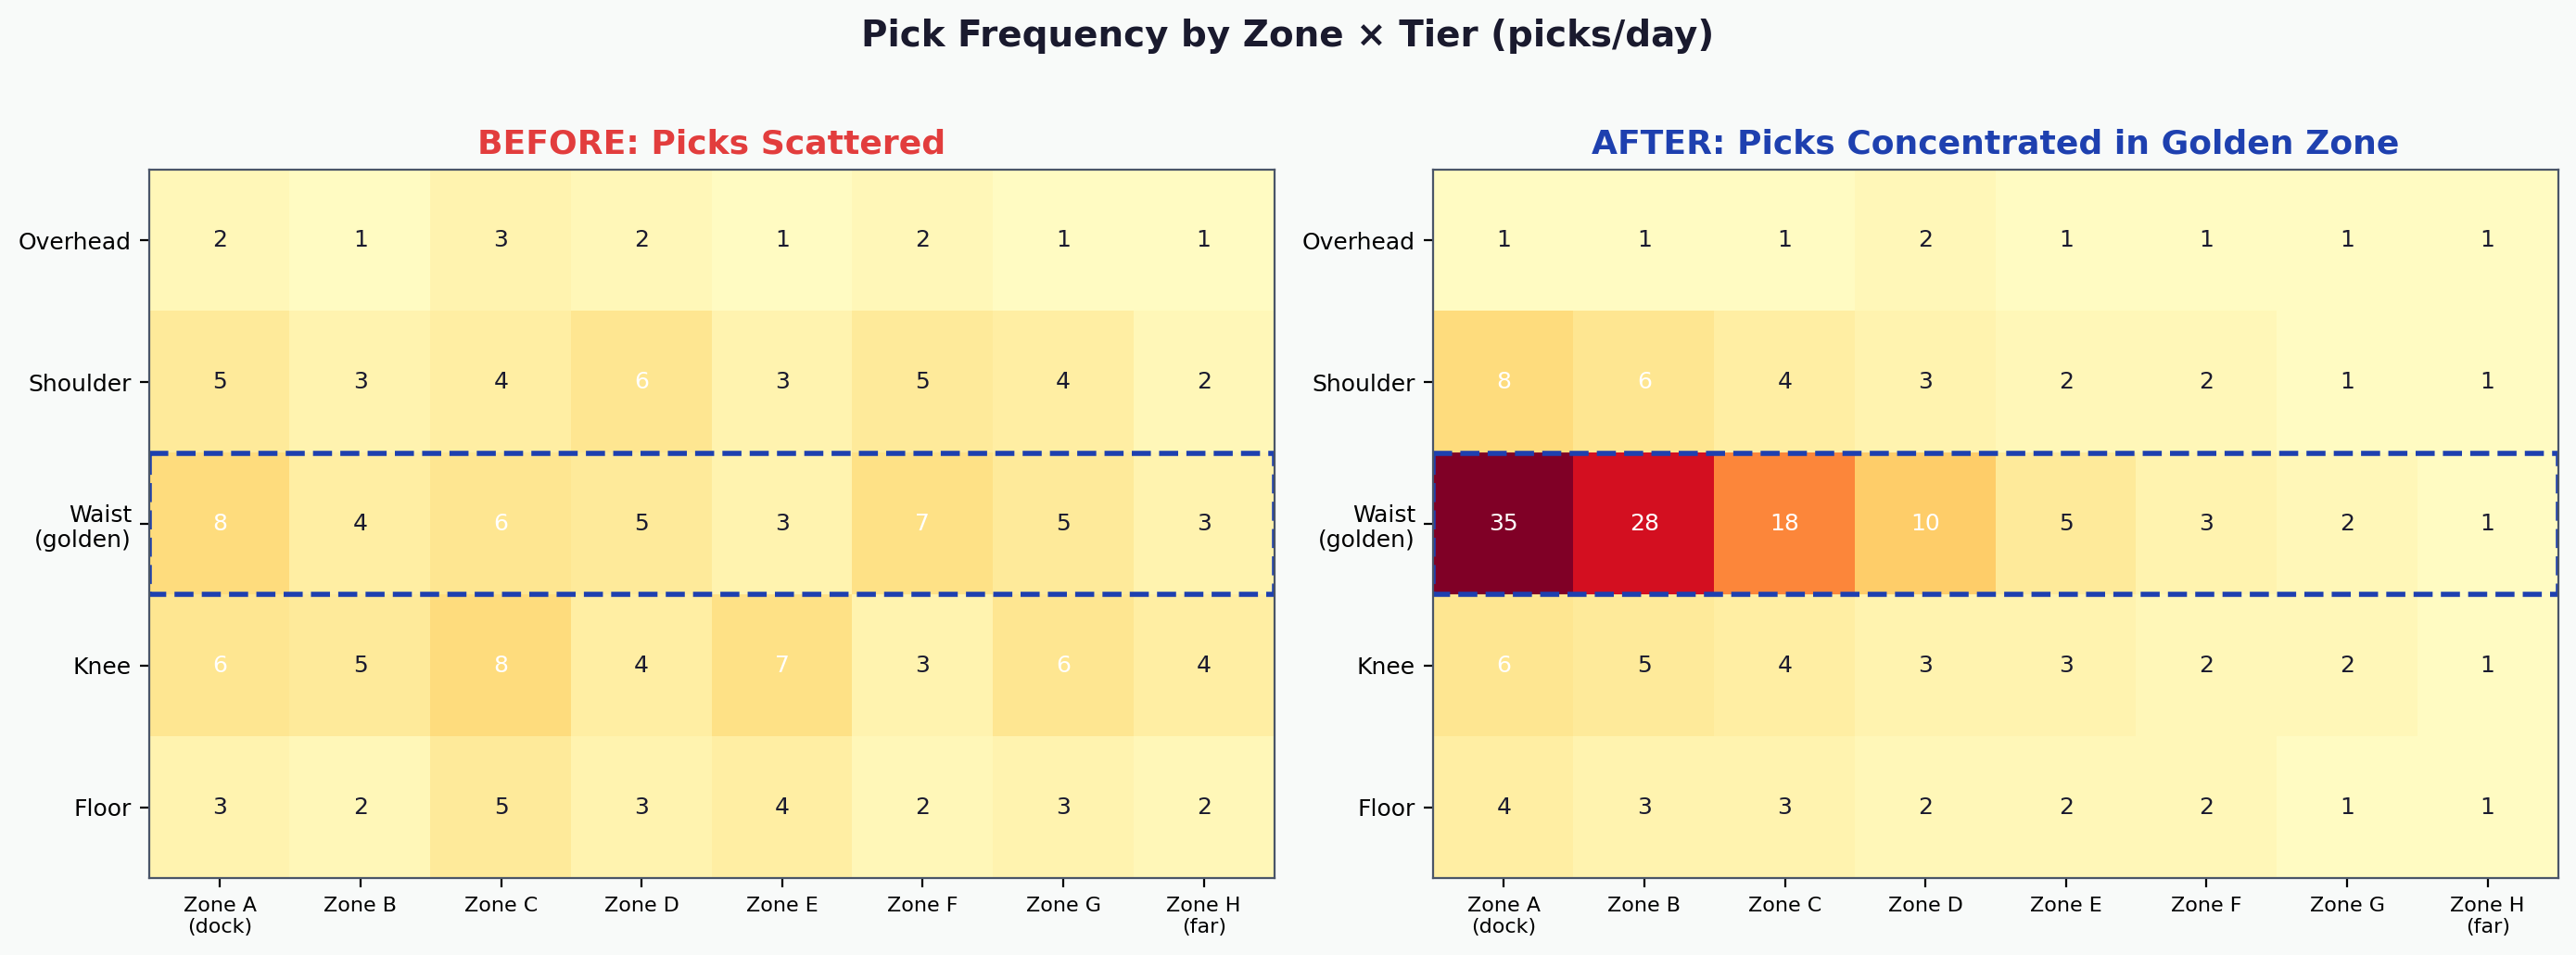
Velocity mismatch: The top 500 SKUs generated 62% of all picks but were scattered across all 8 zones. A picker filling a typical 12-line order walked an average of 280 meters, crossing 4–5 aisles per trip. The golden zone (waist-height shelving near the packing station) was occupied by slow-moving premium items placed there years ago.
Space waste: Small fast-movers (snack bars, spice jars, cosmetics) occupied full pallet slots designed for bulk goods. A pallet slot holds 1.2 m³ but a case of spice jars needs 0.04 m³ — 97% wasted cubic space. Meanwhile, oversized items overflowed their assigned shelf slots into the aisle.
Co-pick blindness: Products frequently ordered together were in different zones. Pasta and pasta sauce: 120 meters apart. Cleaning spray and paper towels: 80 meters apart. Every co-pick added a full aisle crossing.
Step 1: Velocity Ranking
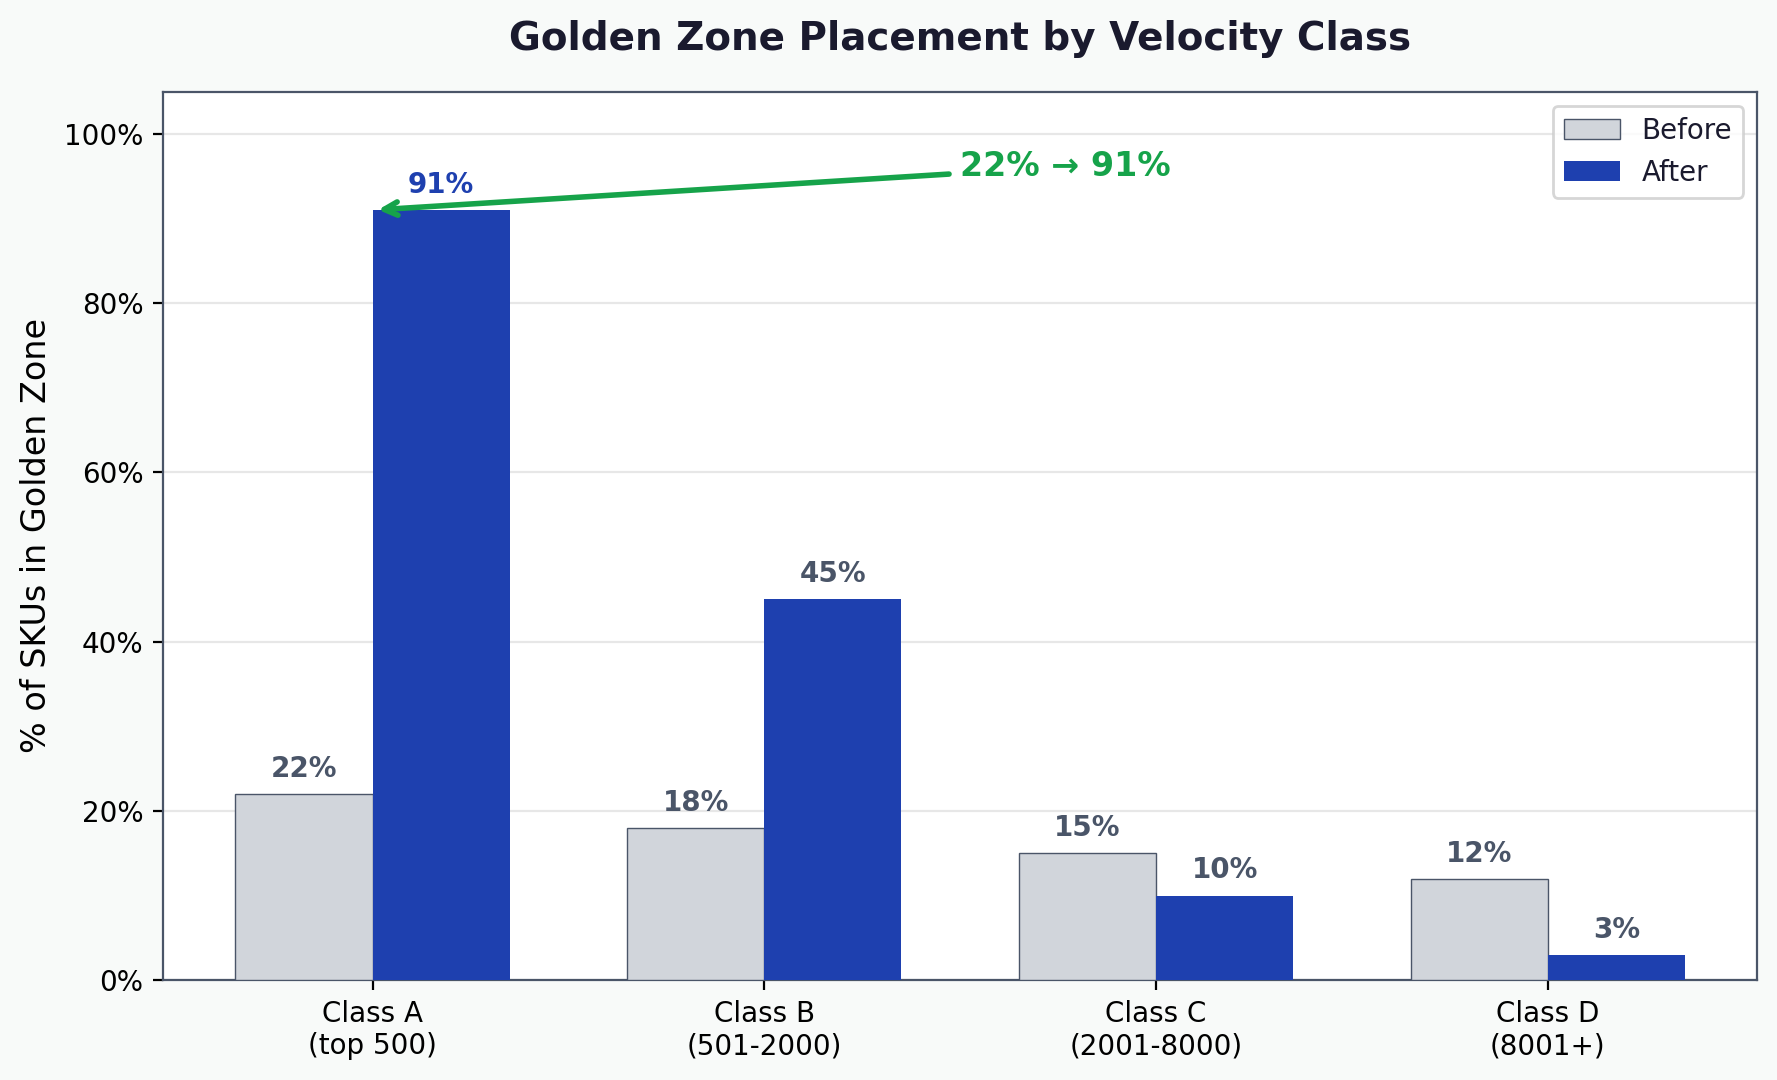
We already had per-SKU demand velocity from the forecasting engine. Enriching it with 6 months of actual pick data from Odoo confirmed the pattern: 3% of SKUs (Class A, top 500) drove 62% of picks. Before optimization, only 22% of Class A SKUs were in the golden zone. After: 91%.
Step 2: Co-Pick Affinity Analysis
From 180,000 historical order lines, we computed which SKU pairs appeared on the same order most frequently. The top 200 affinity pairs accounted for 18% of multi-line orders. Pasta + sauce co-occurred on 34% of pasta orders but sat 120 meters apart. Baby formula + wipes co-occurred on 41% of baby orders, 85 meters apart. After slotting, high-affinity pairs were placed in adjacent slots.
Step 3: 3D Bin Packing
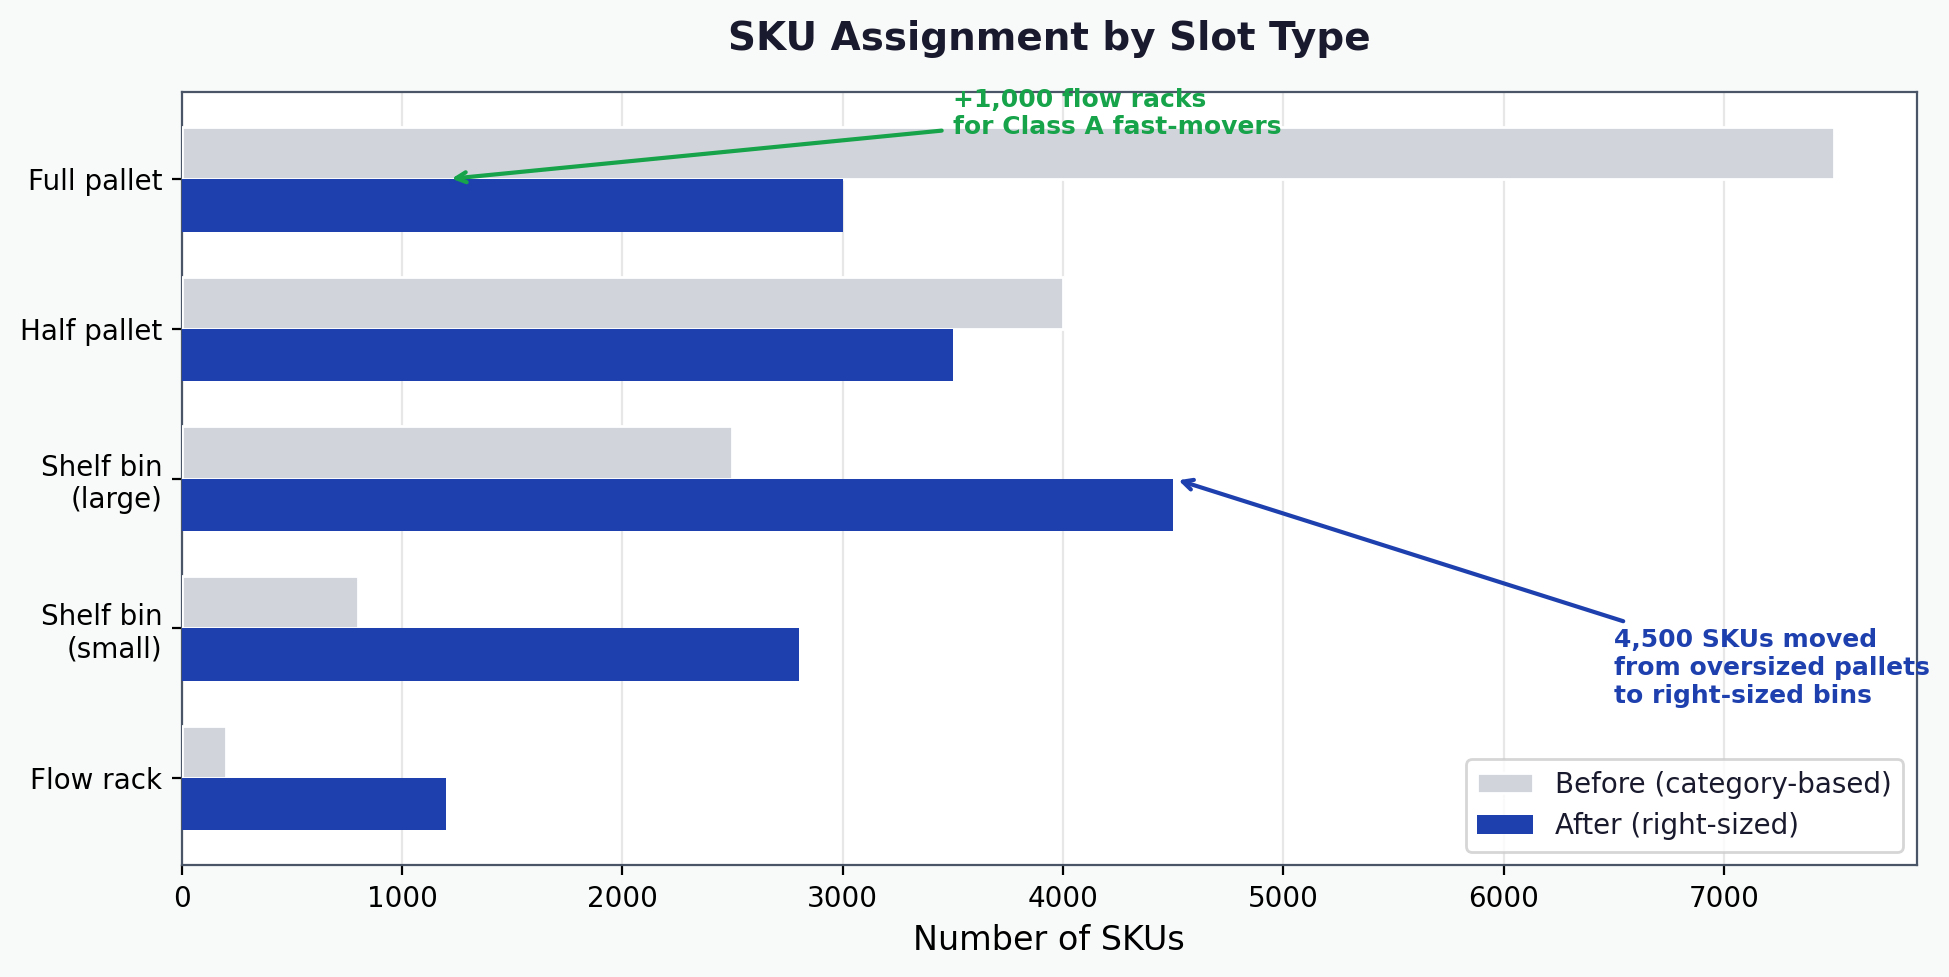
For each SKU, we computed the actual cubic space needed at peak inventory using the order_up_to values from the earlier engagement. Then we matched every SKU to the smallest slot type that fits: flow racks for high-velocity small items, shelf bins for medium goods, half and full pallets only for items that genuinely need them.
Before: 4,200 SKUs were in oversized slots. 800 overflowed their assigned space. After right-sizing, 1,100 pallet-equivalent slots were freed — new capacity without building anything.
Step 4: Slotting Optimization

All three inputs — velocity ranking, co-pick affinity, physical fit — fed into the slotting optimizer. Class A SKUs went to the golden zone near the dock. High-affinity pairs were placed in adjacent slots. Heavy items moved to floor level. Temperature zones remained hard constraints.
The output: new slot assignments for all 15,000 SKUs, exported as a migration plan with priority waves. Odoo stock.location records updated, new Zebra shelf labels printed. Migration executed over 2 weekends with minimal disruption.
Results
| Metric | Before | After | Change |
|---|---|---|---|
| Picks per hour | 65 | 94 | +45% |
| Average pick path per order | 280m | 155m | -45% |
| Golden zone: Class A coverage | 22% | 91% | +69 pp |
| Cubic space waste per slot | 35% | 11% | -24 pp |
| Mispicks per day | 8 | 2 | -75% |
| Pallet slots freed | — | 1,100 | new capacity |
45% more picks per hour across 45 pickers is the equivalent of 20 additional workers without hiring. At approximately 180 CZK/hour fully loaded, that translates to around 540K CZK per month in productivity gains — roughly 6.5M CZK per year. The slotting project (analysis, 2 weekend migrations, new labels) cost under 200K CZK. Payback: 11 days.
The Full Stack
| Layer | What It Answers |
|---|---|
| Demand Forecast | How much of each SKU will we need? |
| Reorder Points | When should we order? |
| Service Level Optimization | How much safety stock, given space limits? |
| Shift Planning | How many people do we need each day? |
| Slotting + 3D Packing | Where does each SKU go in the warehouse? |
Same data foundation. Five different decisions optimized.